
Principles
- Compare and contrast available monitoring methods (UI, CLI, API, etc.)
- Monitor infrastructure components
- Control Cluster Health
- Manager Health
- Hypervisor Health
- Perform Inbound/Outbound activity monitoring
- Enable data collection for single/multiple virtual machines
- Perform virtual machine activity monitoring
- Monitor activity between inventory containers (security groups, AD groups)
- Analyze network and security metrics in vRealize Operations
- Monitor logical networks and services
- Identify available statistics/counters
- Network/service health
- Configure and collect data from network
References
- NSX Administration Guide
http://pubs.vmware.com/NSX-62/topic/com.vmware.ICbase/PDF/nsx_62_admin.pdf
- NSX Command Line Interface Reference
http://pubs.vmware.com/NSX-62/topic/com.vmware.ICbase/PDF/nsx_62_cli.pdf
Compare and contrast available monitoring methods (UI, CLI, API, etc.)
Monitor infrastructure components
NSX -> Dashboard shows a good summary of current system health including:
- System Overview (Manager, Controllers)
- Fabric Status (Host Preparation)
- Service Deployment Status
- Firewall Status
- Logical Switch Status
- Backup Status

NSX -> Installation and Upgrade:
- Host Preparation
- Cluster status
- Communication Health status

Control Cluster Health
NSX -> Installation and Upgrade: NSX Controller Nodes

Manager Health
NSX -> Installation and Upgrade: NSX Managers

NSX Manager We UI -> Summary

Hypervisor Health
See Host Preparation above.
Also, check the native vSphere Host Health: Hosts and Clusters -> Cluster -> Summary

Perform Inbound/Outbound activity monitoring
As of NSX 6.3.0, the NSX Activity Monitoring feature has been deprecated.
Use Endpoint Monitoring from 6.3.0 onwards
- Install Gust Introspection Driver on Windows VMs (from inside the VM itself)
- Right click on “VMware Tools” and select Change
- Add VMCI driver
- Deploy Guest Introspection VMs from
NSX -> Installation and Upgrade -> Service Deployment: Add

Enable data collection for single/multiple virtual machines
Modify the “Activity Monitoring Data Collection” Security Group in Service Composer to include the Windows VMs to be monitored (Linux is not supported)
Perform virtual machine activity monitoring
- Log in to the vSphere Web Client.
- Click Networking & Security and then Activity Monitoring.
- Click the VM Activity tab.
- Click the link next to Where source. Select the virtual machines for which you want to view outbound traffic. Indicate whether you want to include or exclude the selected virtual machine(s) from the report.
- Click the link next to Where destination. Select the virtual machines for which you want to view inbound traffic. Indicate whether you want to include or exclude the selected virtual machine(s) from the report.
- Click the During period (
 ) icon and select the time period for the search.
 - Click Search.
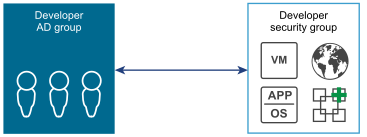
Monitor activity between inventory containers (security groups, AD groups)
- View traffic passing between defined containers such as AD groups, security groups
- Helps to identify & configure access to shared services
Interaction between containers
- Log in to the vSphere Web Client.
- Click Networking & Security and then Activity Monitoring.
- Select the Inter Container Interaction tab in the left pane.
- Click the link next to Originating from.
All groups discovered through guest introspection are displayed.
- Select the type of user group that you want to view resource utilization for.
- In Filter, select one or more group and click OK.
- In Where the destination is, select is or is not to indicate whether the selected group should be included in or excluded from the search.
- Click the link next to Where the destination is.
- Select the group type.
- In Filter, select one or more group and click OK.
- Click the During period (
 ) icon and select the time period for the search.
 - Click Search.
Analyze network and security metrics in vRealize Operations
- Deploy NSX vRealize Operations Management Pack for NSX for vSphere
- Main Dashboard
- Provides an overview of the health of the network objects
- View network traffic information and NSX-related open alerts
- Topology Dashboard
- Provides details about the topology of a selected
- Object Path Dashboard
- Run a visual path between two objects and see how they are connected to each other and other objects in the environment
- Troubleshooting Dashboard
- Run various actions to assist in troubleshooting connectivity problems
- Universe Dashboard
- Monitor cross-vCenter NSX environment
Monitor logical networks and services
Identify available statistics/counters
From UI
Go to Edge -> Manage -> Interfaces
Select Interface and click on graph icon ![]() under Statistics Tab to display stats
under Statistics Tab to display stats

From CLI
Logon to Edge and enter “Show interface [vcnic]”
| vNic_0 Link encap:Ethernet HWaddr 00:50:56:9B:4B:6D
inet addr:192.168.1.201 Bcast:192.168.1.255 Mask:255.255.255.0 inet6 addr: fe80::250:56ff:fe9b:4b6d/64 Scope:Link UP BROADCAST RUNNING MULTICAST MTU:1500 Metric:1 RX packets:132842 errors:0 dropped:63 overruns:0 frame:0 TX packets:15448 errors:0 dropped:0 overruns:0 carrier:0 collisions:0 txqueuelen:1000 RX bytes:8757715 (8.3 Mb) TX bytes:695975 (679.6 Kb) |
Network/service health
- Service Health can be viewed from
- Dashboard -> Service Deployment Status
- Installation and Upgrade -> Service Deployment
- Network Health:
- Dashboard -> Logical Switch Status
- Dashboard -> Edge Notifications
- Dashboard -> System Overview: Controller Nodes
- Dashboard -> Fabric Status
- Controller CLI
| nsx-controller # show control-cluster status
Type Status Since ——————————————————————————– Join status: Join complete 07/26 16:29:34 Majority status: Connected to cluster majority 08/05 11:11:06 Restart status: This controller can be safely restarted 08/05 11:10:56 Cluster ID: 99b4d063-0e52-4b4f-8e0e-60ccc88803e3 Node UUID: 99b4d063-0e52-4b4f-8e0e-60ccc88803e3 |
| nsx-controller # show control-cluster core stats
messages.received 22242 messages.received.dropped 0 messages.transmitted 22260 messages.transmit.dropped 0 messages.processing.dropped 0 connections.up 9 connections.down 7 connections.timeout 0 connections.active 2 connections.sharding.subscribed 2 |
| nsx-controller # show control-cluster logical-switches vni-table
VNI Controller BUM-Replication ARP-Proxy Connections VTEPs Active 5000 192.168.1.104 Enabled Enabled 1 1 true 5001 192.168.1.104 Enabled Enabled 0 0 true 5002 192.168.1.104 Enabled Enabled 1 1 true |
Test Transport Network connectivity from ESXi CLI
vmkping ++netstack=vxlan -d -s <packet size> <vmknic IP>
Set <packet size> to at least 1572 to test for 1600-byte frames
Configure and collect data from network
Flow Monitoring
- Traffic analysis tool that provides a detailed view of the traffic to and from protected
virtual machines - Shows traffic flow between 2 VMs
- Can monitor flows live
- Maximum capture = 2 weeks
- Affects performance so should be used with care

IPFIX
- IPFIX: Internet Protocol Flow Information Export
- Protocol defining flow information export standard from end device to monitoring system
- Enable IPFIX on:
- vSphere Distributed Switch (VDS)
- Distributed Firewall (DFW)
- After IPFIX enabled on a vDS it periodically sends messages collector
- Message contents formatted in line with IPFIX Templates
- Tracks DFW flows
- Logical Switch flows requires Netflow Collector to be enabled on the vDS
Application Rule Manager (ARM)
- Short term flow monitoring to provide an application for micro-segmentation
- Creates Security Groups for existing applications
- ARM learns about flows in/out of application being profiled + flows between application tiers
- Also learns about Layer 7 Application Identity
Traceflow
- Injects packets into a vDS port and provides various observation points along the packet’s path as it traverses physical and logical entities
- Each entity reports the packet handling on input and output
- Different to request/response of Ping: monitors a single packet through overlay network
- Packet is monitored as it crosses the overlay network until it reaches guest VM
- Injected traceflow packet is never actually delivered to the destination
- Therefore, traceflow work even when the destination VM is powered down
- Where L2 bridging is configured, traceflow reports packet delivered if it breaks out onto the VLAN without checking i.e. it treats the VLAN as the destination
- For multicast traffic, the source is a VM vNIC, and the destination is a multicast group address
- API offers more granular configuration options
Supports the following traffic types:
- Layer 2 unicast
- Layer 3 unicast
- Layer 2 broadcast
- Layer 2 multicast
Packet:
- Source = vNIC
- Destination = Any device in overlay or underlay networks (south of the PGW)
- Considered a L2 flow if source/dest in same VXLAN
Packet Capture
- Packet Capture sessions captured on Hosts in a downloadable file in pcap format
- Max 16 sessions, 400 MB files are available to download
- Sessions remain active until any of the following limits are reached:
- 10 minutes
- File size = 20 MB
- Number of packets = 20,000 packets
- Cannot capture on NSX VM Interfaces